Congratulations on making a commitment to grow your wealth by trading cryptocurrencies!
Please print it out and practice it each time you trade so that it becomes super easy, natural and easy for you.
Crypto Trading Cheat Sheet
Before we start we want to outline your goals, the General Crypto Trading Mindset you should have to succeed and easy rules to follow to minimize risks and optimize your profits.
Your goals with trading cryptocurrencies:
- Increase the quantity of Bitcoin that you have.
- Accumulate cryptocurrencies for your long term purchasing them at low Prices in the dips so you can sell them later for large profits.
- Protect Your Wealth & Boost your Financial Net Worth In USD Value
The ONLY way you are going to achieve that and your ONLY focus with those Trading signs is that you BUY LOW and SELL HIGH, That's It!
You're Going to identify to the best of your ability with the help of these simple To use trading signs whether it is a BUY ZONE area today, whether this cryptocurrency which you're trading right now for Bitcoin is in the low place, at the close of the bear trend and going to break out with positive gains.
Here are a couple of very important rules to ensure you minimize your risks!
- Be Sure You hold your Bitcoin and altcoins in Trezor or Ledger Nano S Hardware wallet to your long term holdings if you do not trade them.
- Spread your trading funds out over 2-3 exchanges, that way if one gets Hacked your whole trading portfolio isn't wiped out.
- Risk no more than 1-2% of your accounts per any trade.
- The greater the trading amount the lower your your stop loss must be. For Example on $1,000 trading account you may us 10% stop loss and $50,000 trading account 2% stop loss.
- Start small, whatever funds in Bitcoin you can put in the market and won't lose any sleep over and practice first on small transactions (0.5% of your trading accounts per trade)
- The strategy from the bear market is to create always 1% – 5% profits
- Move for more quality transactions than quantity of transactions, trade less and earn more! If the trade is bad and all indexes tell to buy, do not buy.
- Take 100% responsibility for your trading decisions even if you're using trading signals!
- Keep in mind that markets always have cycles, so don't be greedy (take Profits and exit transactions ) and do not be fearful (market in bear trends when assets are undervalued).
Now what do you need to begin?
- Create an account on the deposit and exchange Bitcoin into the Exchange (We love Binance and Kucoin )
- Use the charting tools such as Coinigy or Tradeview.
On Your exchange ALWAYS place a two Factor Authenticator using a Google Authenticator App and SMS Authentication, so that hackers will not be able to access your accounts.
Let us start with the Indicators…
-
Fibonacci Retracement:
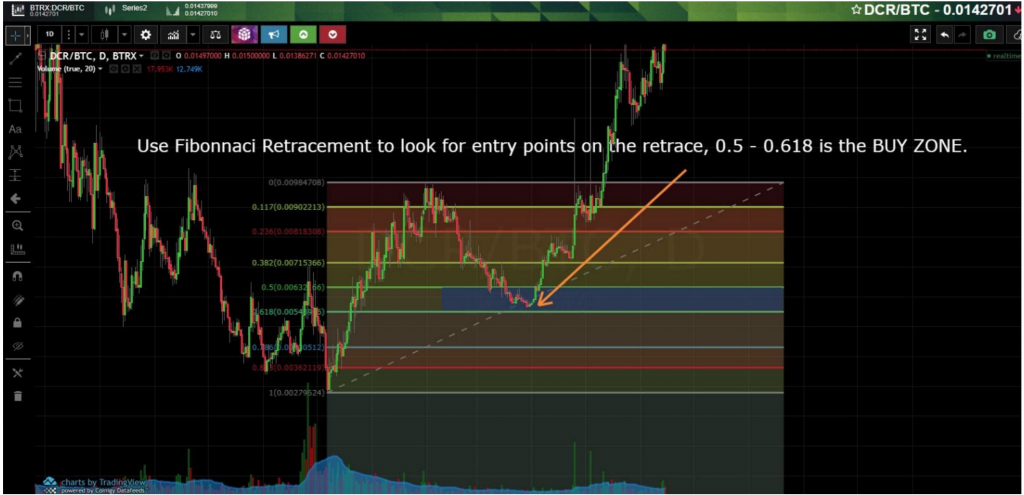
BUY ZONE IS MORE THAN 50% AT LEAST FROM THE LAST RETRACEMENT (SWEET SPOT is 50% – 61.8%) AND IDEALLY AT MAGICAL 88%!
Dealers use the Fibonacci retracement levels (or Fibs in brief ) as Potential support and resistance areas and goal for entering/exiting trades.
So as to find these Fibonacci retracement levels, you have to find that the recent significant Swing Highs and Swings Lows.
So to find the SUPPORT area to Purchase, Begin by drawing out a Fib Retracement on the DAILY chart!
- Click: bottom of a downtrend
- Click: top of the uptrend
Downtrend = always lower highs and lower lows
Uptrend = always higher highs and higher lows
NOTE: Larger time frames (4hr, 1 Day) Provide better analysis but lower Time frames may be used for day transactions and swing trades (5 min, 15 min, 1 hr, 4hr)
-
Trendlines:
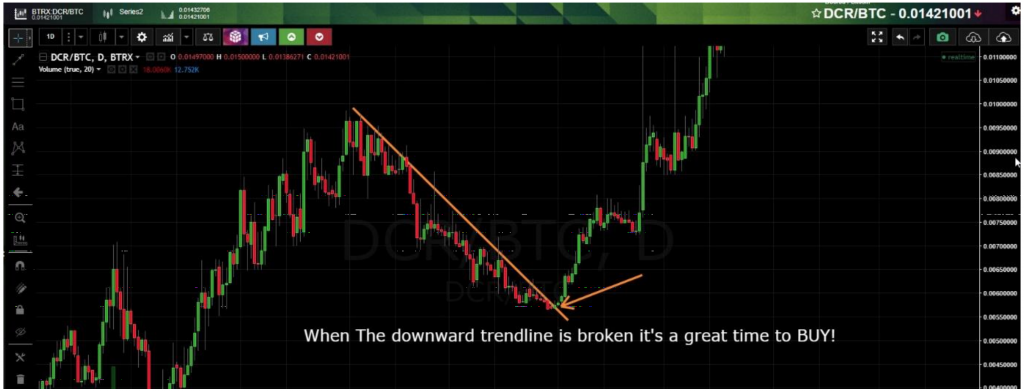
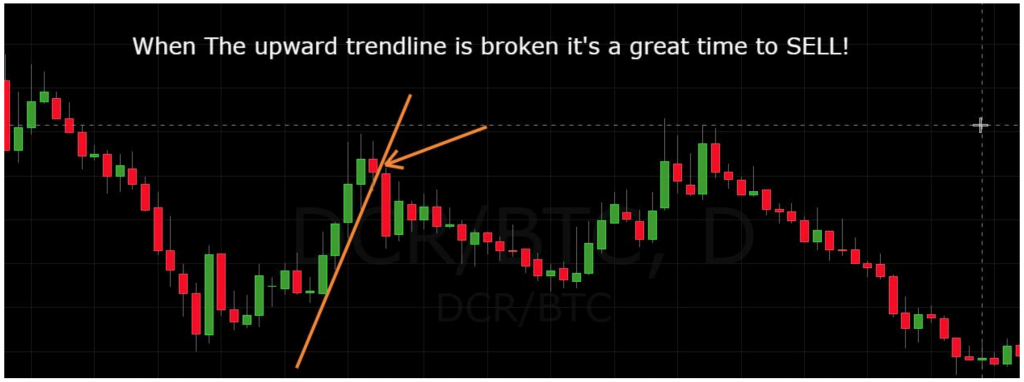
BUY WHEN THE CANDLESTICKS BROKE THROUGH THE DOWNWARD TRENDLINE AND SELL WHEN THE CANDLESTICKS BREAK THE UPWARD TRENDLINE!
- 3 lines touching across the trendline constitute a positive legitimate trendline, 2 touches Contain a tentative one
- Longer lines are more powerful and will respond with more strength to breaching them
- Larger time frames are more likely to give legitimate lines
- The STEEPER the trend line you draw, the less reliable it's going to be and the more likely it is that it's going to break.
- Like horizontal support and resistance levels, trend lines become Stronger the more often they're tested.
- DO NOT EVER draw trend lines by forcing them to match the marketplace. If They don't fit right, then trend line is not a valid one!
- Attempt to draw to the wicks but this is not a hard rule. Do not skip a positive trendline simply because the wick of a fake out interferes with it.
- We use the 1H, 4H, and 1D to draw our trendlines
- Watch out for lines that were broken – if a trendline Breaks down, it is a signal to market, when a trendline breaks up, it is a signal to buy.
-
Bollinger Bands:
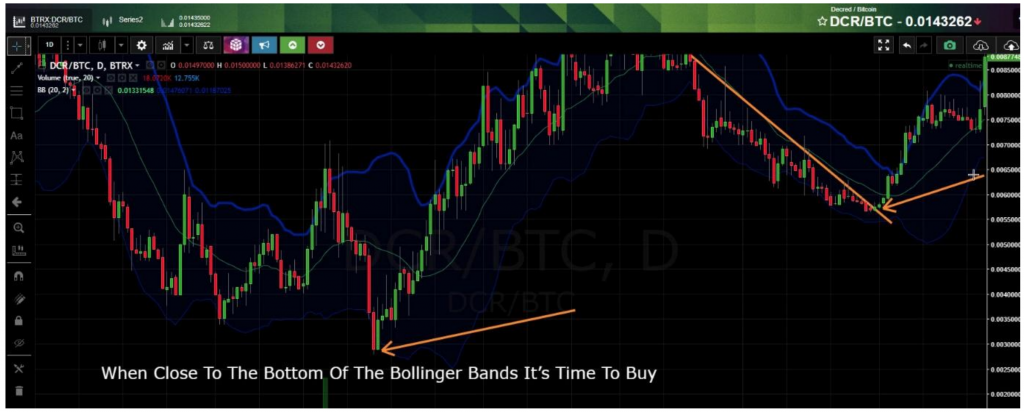
When Close To The Bottom Of The Bollinger Bands It's Time To Buy And After Close To The Top It's Time To Sell!
Bollinger Bands measure the volatility of cryptocurrency
-
RSI (Relative Strength Index):
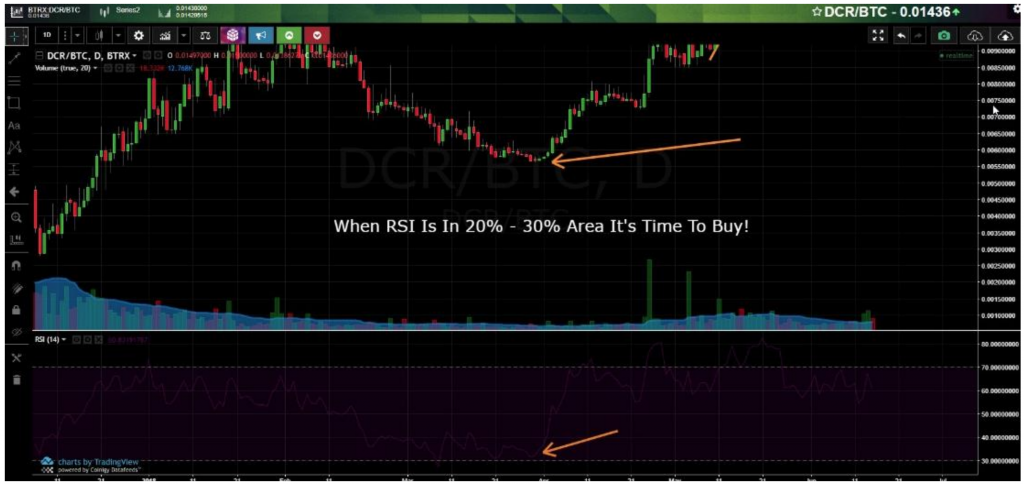
Buy When RSI Is In 20% – 30% region and Sell When RSI Is In 70% – 80% Area.
Relative Strength Index (RSI) is a momentum oscillator that steps The rate and change of price moves. RSI oscillates between zero and 100. RSI is considered overbought when above 70 and oversold when under 30.
-
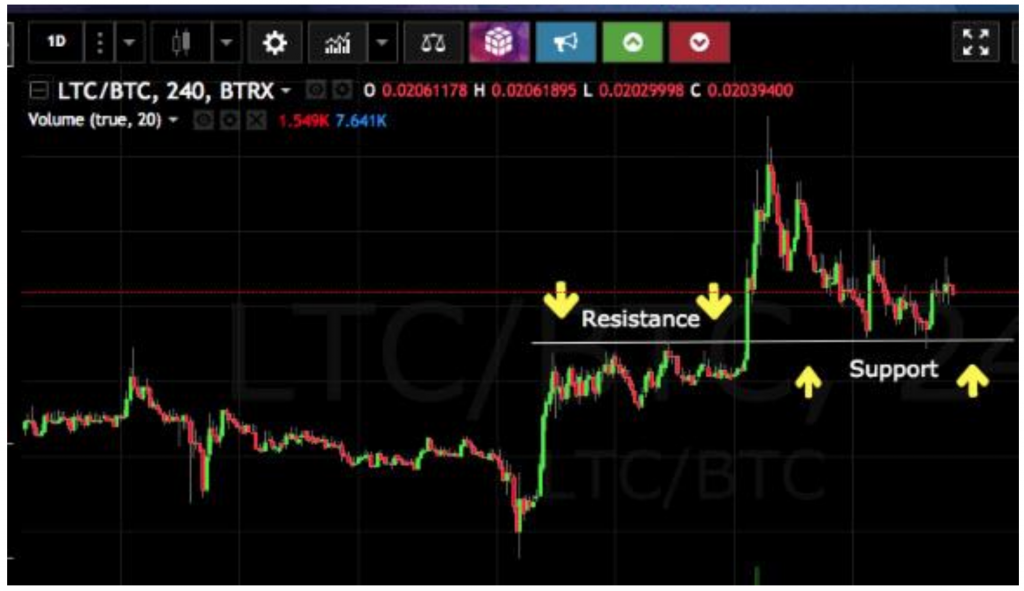
Support And Resistance:
Buy SUPPORT AND SELL RESISTANCE!
When the market moves up and then pulls back, the Maximum point Reached until it pulled back down is currently resistance.
As the marketplace continues up again, the lowest point reached before it Started up is currently support.
In this way, resistance and service is always formed as the marketplace oscillates over time. The opposite is true for the downtrend.
If buy satisfactorily breaches a sell level, it becomes immunity. If Price satisfactorily breaches a resistance level, it becomes support. Price Will often retest earlier breakout points to affirm past confirm is now support. The Buy Price will proceed in these zones and after it breaks over Prior resistance (known as a breakout) it will often return Down to this area a couple of times to confirm it's now support for the following move up.
